

Till now we have covered Requirements Module, Test Plan Module, Test Lab Module and Defects Module of Quality Center. In this article we’ll discuss Dashboard Module.
Dashboard Module enables a user to create customized reports. Knowledge of SQL and VB Scripting is required, as queries should be written in SQL for fetching the details of various modules in QC.
Here is a step by step introduction to Dashboard module.
- Open QC application and provide the valid user name and password. Select the domain name and the required project name from the drop down list.
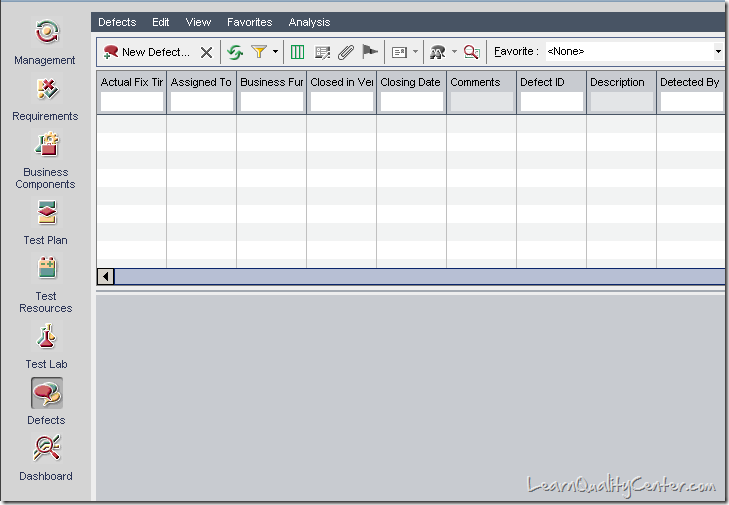
- Click on the “Dashboard†module present on the left hand side corner of the application as shown below.
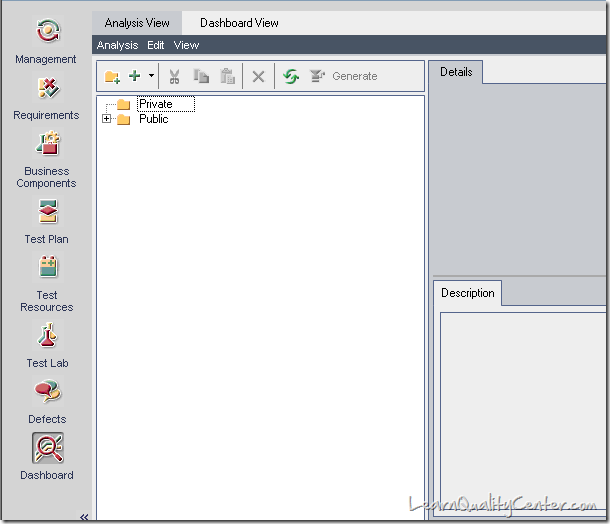
- The window opens as shown above. We find two tabs in the menu bar “Analysis View†and “Dashboard Viewâ€.
- Click on Analysis View and the user can find two folders by default “Private†and “Publicâ€. A user can create the reports in private folder and only he/she can view the report and nobody else can look into the report present in private folder. A report created in public folder can be viewed by everyone who have access to the particular project.
- Click on the New folder(Ctrl+Alt+F) option present below the menu bar to create a new folder.
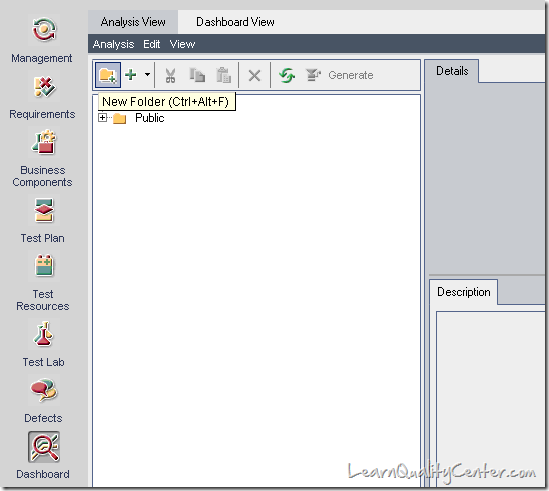
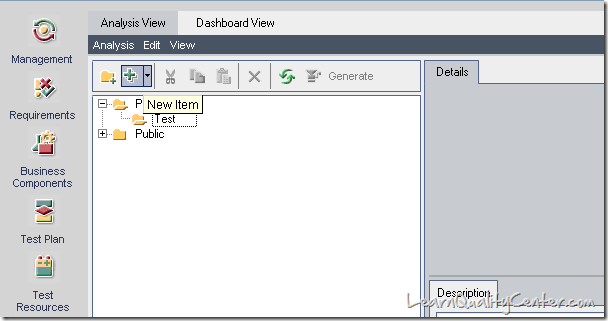
- Navigate on the new folder created and click on the new Item option present below the menu bar for creating a new report.
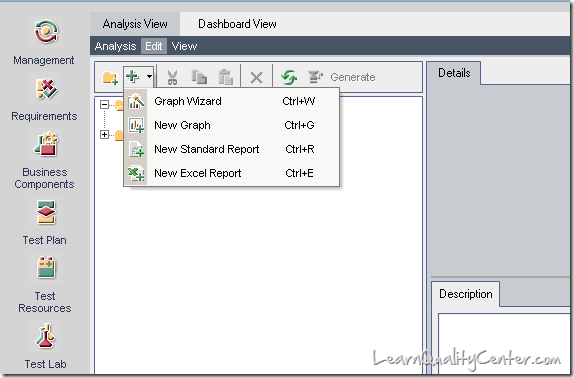
- Once the user clicks on the option “New Item†four options will be available to choose. Select “New Excel Report†for creating a customized report.
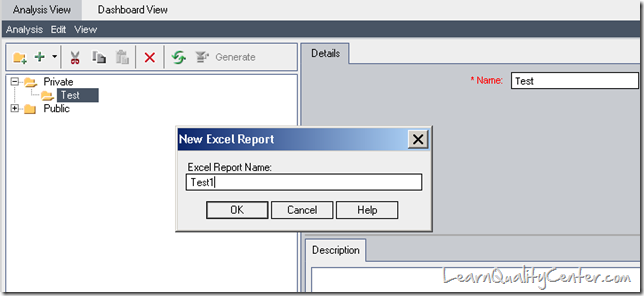
- Once the option “New Excel Report†is selected a pop up opens up asking the user to enter the name of the new report. Provide a name for the report as shown below.
- Once the user clicks on OK a new blank report is created under the Test folder as shown below.
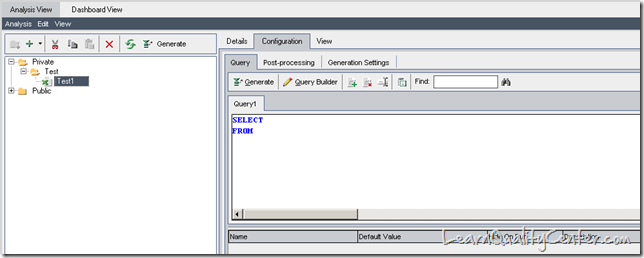
- The user can view three options on the menu bar Details,Configuration and View
- Details – This tab contains the name of the new report, Owner, Type of report etc.
- Configuration – This tab contains the actual query, Post Processing section and all the other options for generating the report.
- View – This tab contains the data and the report results of the report generated.
- Under the Configuration tab we have three more sub tabs as mentioned below.
- Query – Here the user can write SQL queries for every module
- Post Processing – The user needs to write VB Scripts for getting the data received from the queries in a readymade fashion. For Example:- A user writes a query to get the defects logged by him/her but when the user runs the query an excel sheet is generated which gives data in a raw format.But with Post processing section a user can readily get the count of the defects logged without filtering the data in the excel sheet.
- Generation Settings – This tab gives user the information of the path where the reports will be saved.
- Click on “Query Builder†option present beside the Generate tab. The following tab opens as shown below.
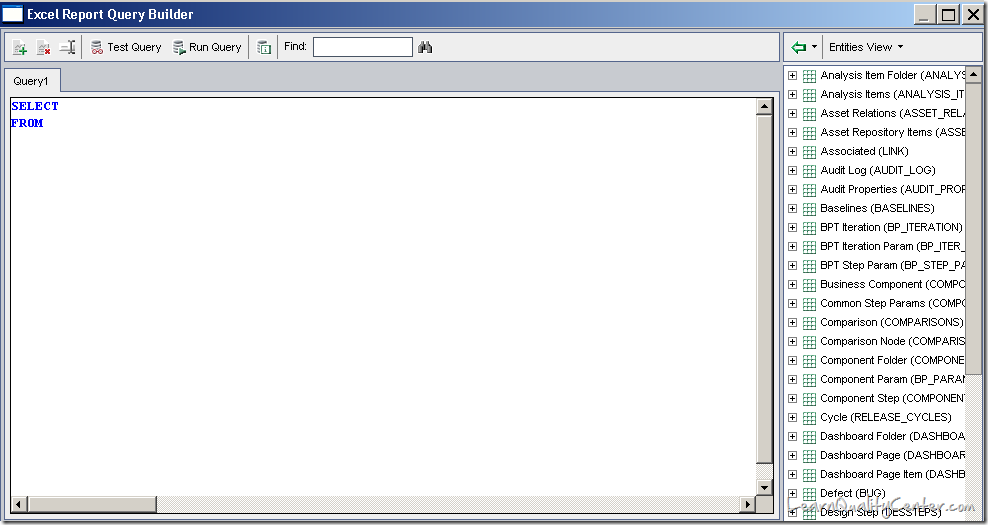
- The Entities present on the right hand side of the window are the table names and the corresponding field names. The user should pull the required table name and the fields required for generating the report.
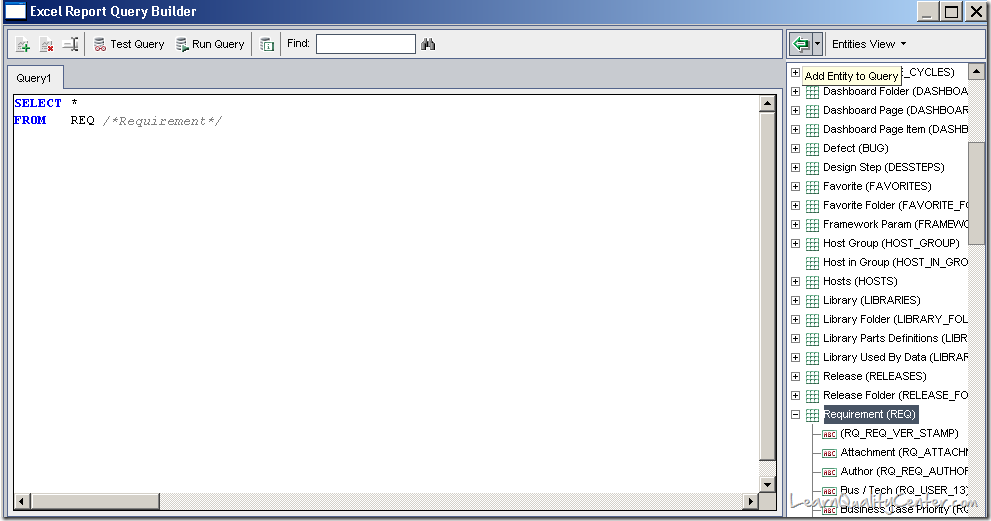
- As per the snap shot above, we have selected *(select all the fields from the table name) from Requirements table name which pops up all the field names present in the Requirements module.
- Once the user clicks on “Run Query†the Query builder runs the query and gives the results to the user as shown below.
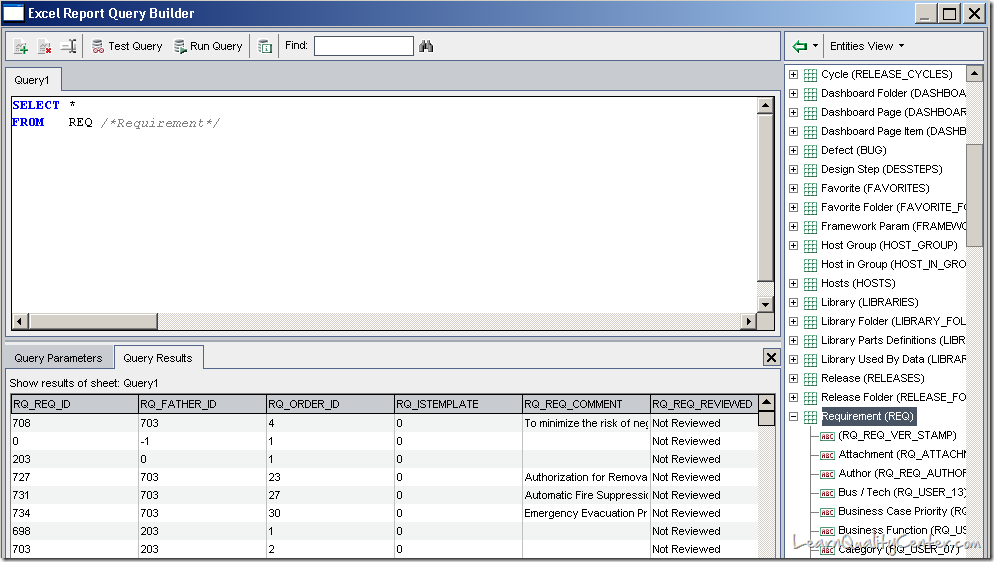
- A user can perform the following operations:
- Add Query – A User can add multiple queries by clicking on this option for different modules.
- Delete Query – A user can delete the existing queries.
- Rename Query – A query can be renamed by clicking on this option.
- Test Query – This option is used to test a query for a limited set of values (max 10).
- Run Query – This option is used to test a query for all the values present in the particular module.
- A user should write the VB Script in the post processing section for generating a readymade report.
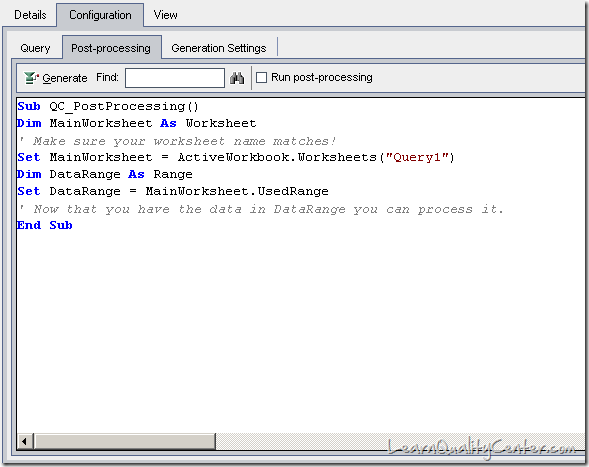
- This is a sample report generated after inputting the query and the writing a VB script in the post processing section.
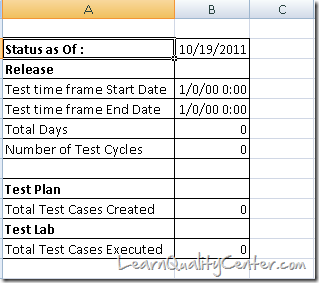
With that we come to the end of Dashboard module. I hope you like this article.
If you’re planning to take Quality Center Certification, don’t forget to check our mock QC certification questions.



 initiative